The Goldcrest is our smallest bird, just eight and a half centimetres from the tip of its beak to the end of its tail, and only half the weight of a Wren — but this hasn't stopped it reaching an all-time high. The latest results from the BTO/JNCC/RSPB Breeding Bird Survey (BBS), published annually, show the Goldcrest reaching its highest level since the survey began in 1994. The run of mild winters up to 2008 has helped more of this largely insectivorous bird to go on to breed the following spring, and between 2007 and 2008 the breeding population increased by over a quarter — a significant change. It remains to be seen weather the cold winter of 2008/09 will reverse this trend. The good news doesn't stop there; two other tiny birds have also reached new heights. The Long-tailed Tit and Chiffchaff also increased between 2007 and 2008, by 17% and 14% respectively.
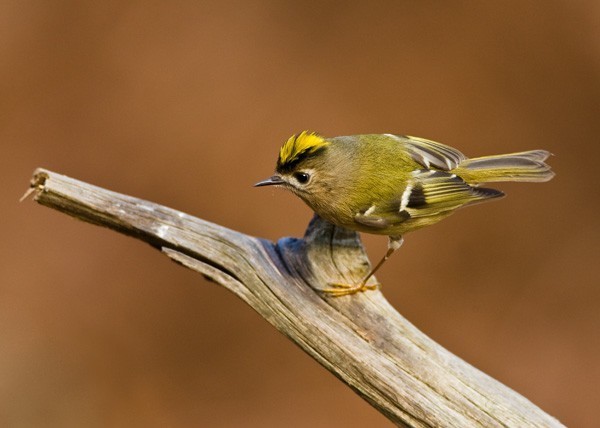
Goldcrest, private site, Norfolk (Photo: David Whistlecraft)
Kate Risely, BBS Organiser at the BTO, said "With the declines in some of our summer migrants featuring in the press recently, it is great to be able to report some good news, particularly when it concerns some of our most charismatic birds. It is thanks to our volunteer surveyors that we know exactly how these birds are doing."
Mark Eaton, Senior Conservation Scientist, Species Monitoring & Research at the RSPB, commented "It is great to see these birds doing well and it will be interesting to see how they have coped with the recent cold winter. With climate change there will be greater extremes in the weather and some birds will cope with this better than others, so monitoring these changes is extremely important."
Pierre Tellier of JNCC commented "The quality of information delivered by the BBS clearly demonstrates its value for understanding what happens to our biodiversity in the wider countryside by monitoring breeding bird species, as it produces population trends not only for the UK but also for individual countries, alerting on species declines, but also on recoveries which can be an indication of the success of conservation effort. All this is made possible thanks to the dedication of thousands of volunteers who gather the information every year."
Regional Round-up
Northeast
Yellowhammer (–34%) declined more than in any other English region, and it is the only region in which Jackdaw declined (–5%). Great Tit has increased by 75% since the start of the Breeding Bird Survey in 1994.
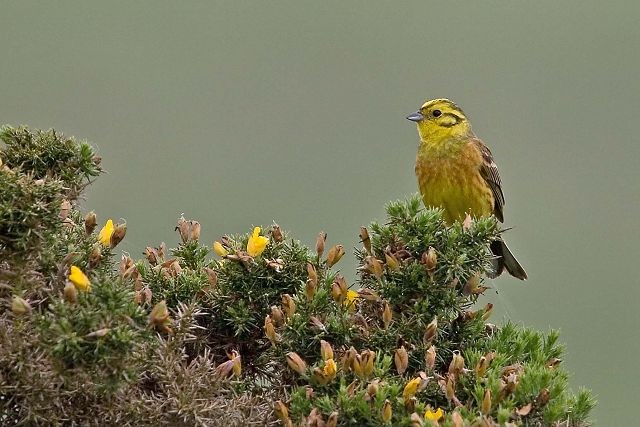
Yellowhammer, undisclosed site, Northumberland (Photo: Garth Peacock)
Northwest
This is the only region in which Mistle Thrush has shown an increase (26%). Blackcap (140%), Chiffchaff (116%), Dunnock (44%), House Martin (32%), Linnet (–8%), Song Thrush (97%), Wren (60%) and Willow Warbler (19%) have all done better than in other English regions. Sparrowhawk (–29%) has declined the most in this region.
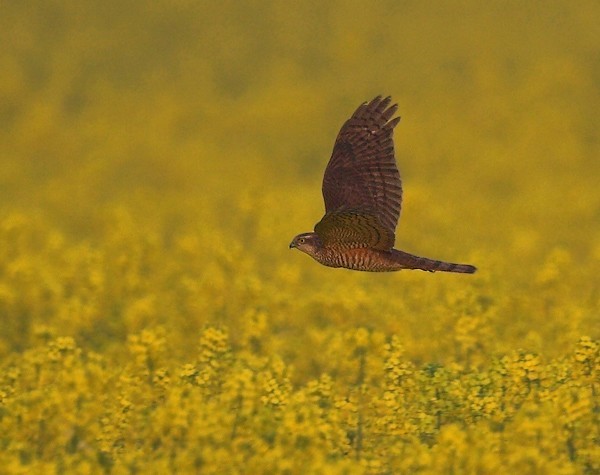
Sparrowhawk, undisclosed site, Lancashire (Photo: Tom Charles)
West Midlands
Goldcrest (111%) and Kestrel (24%) have increased more here than in any other region. Curlew (–49%) and Jay (–29%) have declined more than in any other region.
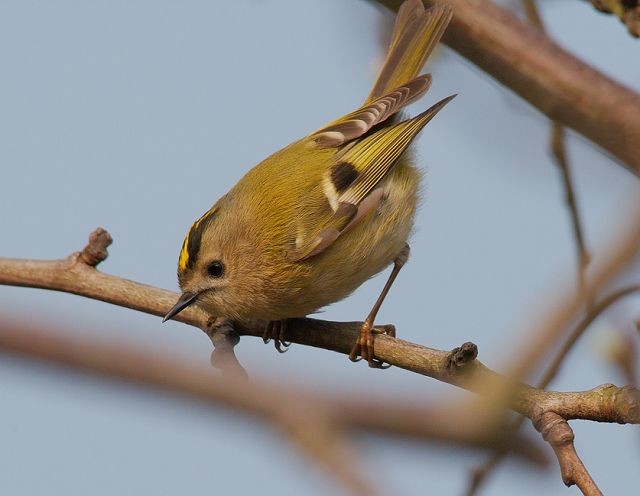
Goldcrest, Leominster, Herefordshire (Photo: George Ewart)
Southwest
This is the only English region in which Garden Warbler (15%) and Meadow Pipit (5%) have increased. Swallow (65%) and Canada Goose (229%) have increased more than in other regions, but Starling (–56%) and Swift (–42%) declined more than in any other region.
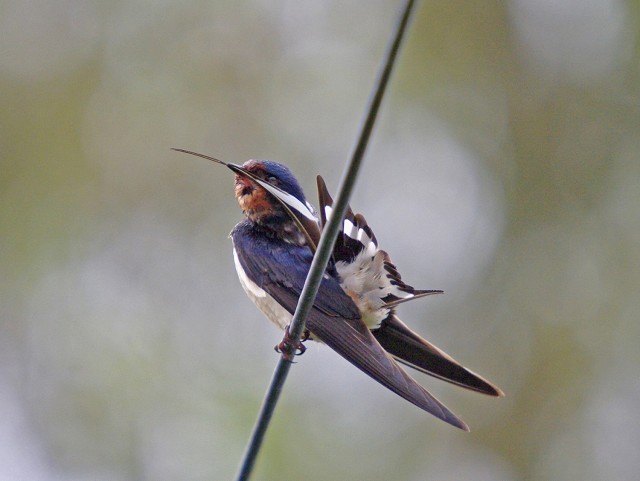
Swallow, Turf, Devon (Photo: Charlie Fleming)
Southeast
Buzzard (648%) and Whitethroat (43%) have increased more than in any other English region. House Martin (–31%), Lapwing (–28%), Long-tailed Tit (–15%), Mistle Thrush (–42%), Robin (8%) and Willow Warbler (–64%) have all fared worse than in other regions, and it is the only region in which Reed Bunting (–14%) and Wren (–7) have declined.
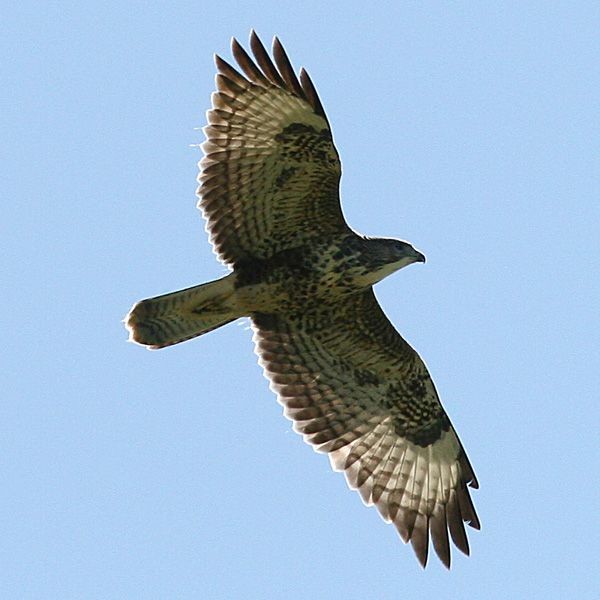
Common Buzzard, Grove Ferry NNR, Kent (Photo: Steve Ashton)
London
Garden birds such as Blue Tit (56%), Chaffinch (162%), Goldfinch (158%), Greenfinch (131%), Great Tit (120%) and Robin (77%) have all increased more here than in the rest of England. However, House Sparrow (–66%) and Song Thrush (–26%) have shown greater declines.
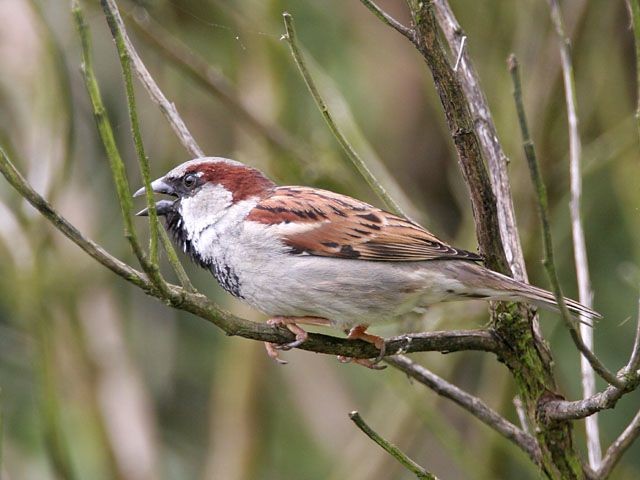
House Sparrow, London Wetland Centre WWT, Greater London (Photo: Fraser Simpson)
East of England
This is the only region in which Coal Tit (–12%) has declined. Collared Dove (80%), Green Woodpecker (159%), Jay (48%), Jackdaw (99%) and Rook (37%) have all increased more than in other regions.
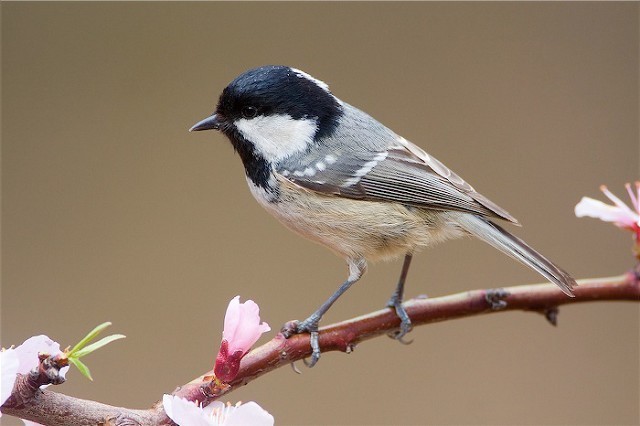
Coal Tit, private site, Norfolk (Photo: Nigel Pye)
East Midlands
Bullfinch (19%), House Sparrow (21%) and Lapwing (76%) have all increased more than in any other English region, and the declines of Starling (–17%) and Yellowhammer (–5%) have been less severe than in other regions. It is the only region in which Swift (4%) has shown an increase. Linnet (–51%), Meadow Pipit (–28%), Pied Wagtail (–30%), Skylark (–30%) and Stock Dove (–39%) have all declined more than in other regions.
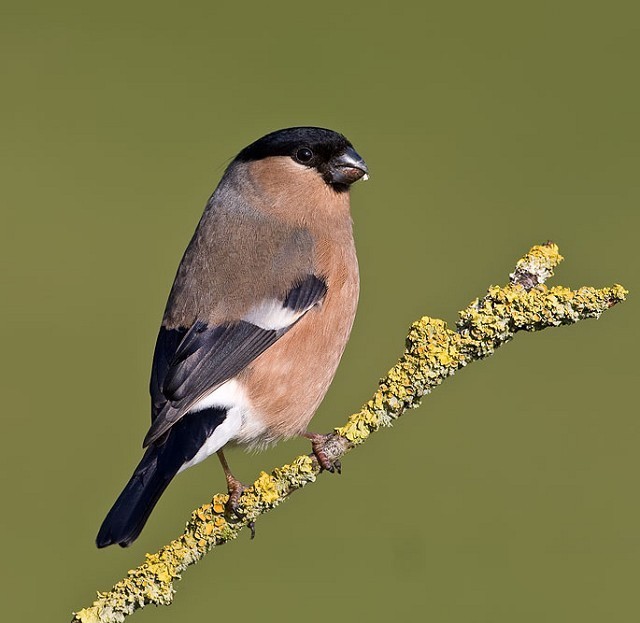
Bullfinch, Lathkill Dale NNR, Derbyshire (Photo: Robert Askew)
Yorkshire and the Humber
The only region in which Skylark (4%) has increased in numbers. Blackbird (57%), Carrion Crow (96%), Long-tailed Tit (64%), Moorhen (56%) and Reed Bunting (57%) have increased more than in other regions. Kestrel (–23%) and Magpie (–19%) have declined the most in this region, and it is the only one in which Whitethroat (–3%) has declined.
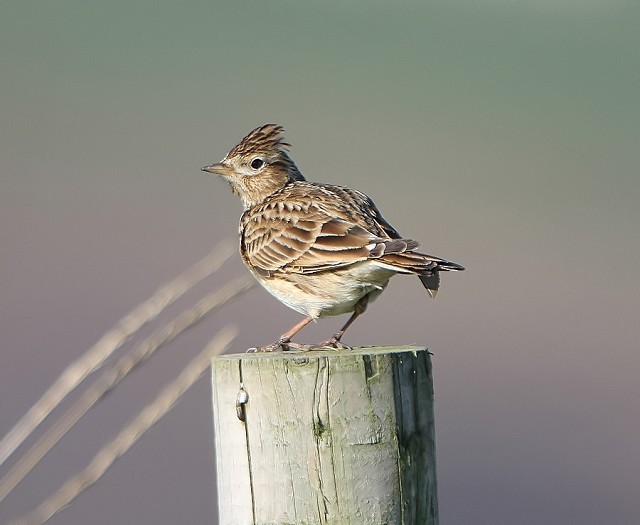
Skylark, Silverwood Lagoons, South Yorkshire (Photo: Dave Hutton)
Scotland
Reed Bunting reached its highest level since the survey began, increasing by 20% between 2007 and 2008. Swallow and Treecreeper also reached an all-time high, showing increases of 22% and 21% respectively between 2007 and 2008. Blackcap and Cuckoo are among a number of summer migrants that are doing better in Scotland than in the UK as a whole, with these species showing increases of 5% and 1% respectively between 2007 and 2008.
Issued by BTO on behalf of BTO, JNCC and RSPB. All the figures refer to the smoothed long-term trends covering the BBS period (1994–2008).
